Electrify Chicago
According to the
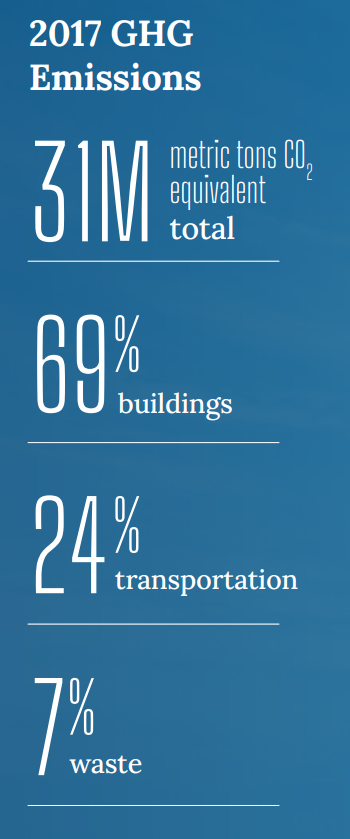
2022 Chicago Climate Action Plan ,
a whopping 69% of Chicago's emissions come from buildings, making it
our biggest challenge and our biggest opportunity as a city to tackle
change. At Electrify Chicago we want to showcase some of the best and worst performing
buildings in the city using publicly available data and manual annotations to add
building photographs and label multi-building owners like universities.
,
a whopping 69% of Chicago's emissions come from buildings, making it
our biggest challenge and our biggest opportunity as a city to tackle
change. At Electrify Chicago we want to showcase some of the best and worst performing
buildings in the city using publicly available data and manual annotations to add
building photographs and label multi-building owners like universities.
You can start by looking at Chicago's buildings with the highest greenhouse gas intensity - this means that they use the most energy when adjusted per unit of square foot, so big buildings could actually perform much better than very inefficient small buildings on this metric.
Chicago Buildings by Greenhouse Gas Intensity
Note: Data only includes large Chicago buildings from 2020
Note: This data only includes buildings whose emissions are reported
under the
Chicago Energy Benchmarking Ordinance. According to the City “As of 2016,
this list includes all commercial, institutional, and residential buildings larger than
50,000 square feet.” This dataset is also then filtered to only buildings with
reported emissions > 1,000 metric tons CO2 equivalent.
This data is also from 2020, but when new benchmark data is available, we'll update the site.
| Property Name / address | Primary Property Type |
Greenhouse Gas Intensity (kg CO2 eq./sqft) |
Total Greenhouse Emissions (metric tons CO2 eq.) |
|---|---|---|---|
|
3711 S VINCENNES AVE
🏆
3711 S VINCENNES AVE
| Multifamily Housing | 3.9 kg/sqft
#24 Lowest
| 1,180 tons
Lowest 13%
|
|
The Sexton Condominium Association
🏆
360 W Illinois St
| Multifamily Housing | 3.9 kg/sqft
#24 Lowest
| 1,537 tons
Lowest 31%
|
|
Bradley Business Center
🏆
2500 W Bradley Pl
| Other | 3.9 kg/sqft
#24 Lowest
| 1,443 tons
Lowest 26%
|
|
Wells Community Academy HS -CPS
🏆
936 N Ashland Ave
| K-12 School | 3.9 kg/sqft
#24 Lowest
| 1,026 tons
#29 Lowest
|
|
Tilden HS -CPS
🏆
4747 S Union Ave
| K-12 School | 3.9 kg/sqft
#24 Lowest
| 1,272 tons
Lowest 18%
|
|
Phillips Academy HS -CPS
🏆
244 E Pershing Rd
| K-12 School | 3.8 kg/sqft
#19 Lowest
| 1,094 tons
Lowest 7%
|
|
Auditorium Building
🏆
430 S Michigan Ave
| College/University | 3.8 kg/sqft
#19 Lowest
| 2,248 tons
Highest 45%
|
|
401 465 E Illinois St
🏆
401 465 E Illinois St
| Multifamily Housing | 3.8 kg/sqft
#19 Lowest
| 1,511 tons
Lowest 30%
|
|
Wentworth Gardens
🏆
3770 S Wentworth Ave
| Multifamily Housing | 3.8 kg/sqft
#19 Lowest
| 3,155 tons
Highest 29%
|
|
Metropolitan Place Condominium Association
🏆
130 S Canal St
| Multifamily Housing | 3.7 kg/sqft
#16 Lowest
| 2,152 tons
Highest 47%
|
|
Dearborn Tower Condominium Association
🏆
1530 S State St
| Multifamily Housing | 3.7 kg/sqft
#16 Lowest
| 2,754 tons
Highest 34%
|
|
Hyatt Chicago Magnificent Mile
🏆
633 N St Clair St
| Office | 3.6 kg/sqft
#13 Lowest
| 2,252 tons
Highest 45%
|
|
329 W 18th St
🏆
329 W 18th St
| Other | 3.6 kg/sqft
#13 Lowest
| 1,821 tons
Lowest 43%
|
|
5252 S CORNELL AVE
🏆
5252 S CORNELL AVE
| Multifamily Housing | 3.6 kg/sqft
#13 Lowest
| 1,219 tons
Lowest 16%
|
|
The ParkShore Condominium Association
🏆
195 N Harbor Dr
| Multifamily Housing | 3.6 kg/sqft
#13 Lowest
| 3,634 tons
Highest 24%
|
Data Source:
Chicago Energy Benchmarking Data