Electrify Chicago
According to the
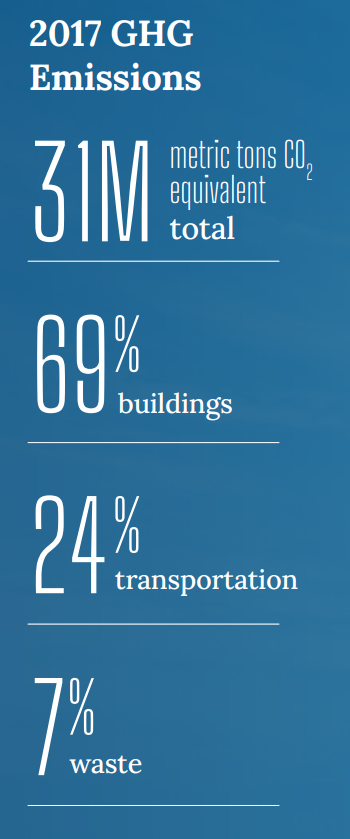
2022 Chicago Climate Action Plan ,
a whopping 69% of Chicago's emissions come from buildings, making it
our biggest challenge and our biggest opportunity as a city to tackle
change. At Electrify Chicago we want to showcase some of the best and worst performing
buildings in the city using publicly available data and manual annotations to add
building photographs and label multi-building owners like universities.
,
a whopping 69% of Chicago's emissions come from buildings, making it
our biggest challenge and our biggest opportunity as a city to tackle
change. At Electrify Chicago we want to showcase some of the best and worst performing
buildings in the city using publicly available data and manual annotations to add
building photographs and label multi-building owners like universities.
You can start by looking at Chicago's buildings with the highest greenhouse gas intensity - this means that they use the most energy when adjusted per unit of square foot, so big buildings could actually perform much better than very inefficient small buildings on this metric.
Chicago Buildings by Greenhouse Gas Intensity
Note: Data only includes large Chicago buildings from 2020
Note: This data only includes buildings whose emissions are reported
under the
Chicago Energy Benchmarking Ordinance. According to the City “As of 2016,
this list includes all commercial, institutional, and residential buildings larger than
50,000 square feet.” This dataset is also then filtered to only buildings with
reported emissions > 1,000 metric tons CO2 equivalent.
This data is also from 2020, but when new benchmark data is available, we'll update the site.
| Property Name / address | Primary Property Type |
Greenhouse Gas Intensity (kg CO2 eq./sqft) |
Total Greenhouse Emissions (metric tons CO2 eq.) |
|---|---|---|---|
|
Jewel Osco, 03181-87th & State St
🚩
87 W 87th St
| Supermarket/Grocery Store | 30.3 kg/sqft #31 Highest
| 2,120 tons
Highest 48%
|
|
Washington Square-North and Cicero Development LLC
🚩
4821 - 4951 W North Ave
| Supermarket/Grocery Store | 30.0 kg/sqft #32 Highest
| 1,742 tons
Lowest 40%
|
|
Jewel at South Loop Marketplace
🚩
1340 S CANAL ST
| Supermarket/Grocery Store | 29.7 kg/sqft #33 Highest
| 2,121 tons
Highest 48%
|
|
Pete's Kedgie
🚩
4700 S Kedzie Ave
| Supermarket/Grocery Store | 29.3 kg/sqft #35 Highest
| 1,585 tons
Lowest 33%
|
|
03262-Irving Park & Cicero
🚩
4660 W Irving Park Rd
| Supermarket/Grocery Store | 29.3 kg/sqft #35 Highest
| 2,074 tons
Lowest 50%
|
|
Jewel Osco, 03176-Ashland & 95th St
🚩
9400 S Ashland Ave
| Supermarket/Grocery Store | 29.3 kg/sqft #35 Highest
| 1,946 tons
Lowest 46%
|
|
Whole Foods
🚩
3201 N ASHLAND AVE
| Supermarket/Grocery Store | 28.9 kg/sqft #37 Highest
| 2,376 tons
Highest 41%
|
|
Jewel Osco, 03344-Roosevelt & Ashland
🚩
1220 S Ashland Ave
| Supermarket/Grocery Store | 28.8 kg/sqft #38 Highest
| 1,828 tons
Lowest 43%
|
|
Mariano's
🚩
3857 S DR MARTIN L KING JR DR
| Supermarket/Grocery Store | 28.6 kg/sqft #39 Highest
| 2,066 tons
Lowest 50%
|
|
Jewel Osco, 03501-Western & Roscoe
🚩
3400 N Western Ave
| Supermarket/Grocery Store | 28.4 kg/sqft #40 Highest
| 1,578 tons
Lowest 33%
|
|
Jewel Osco, 02508-Howard & Clark
🚩
1763 W Howard St
| Supermarket/Grocery Store | 28.3 kg/sqft #42 Highest
| 1,986 tons
Lowest 48%
|
|
Stroger Hospital Campus
🚨
1901 W Harrison St
| Hospital (General Medical & Surgical) | 28.3 kg/sqft #42 Highest
| 45,230 tons #7 Highest
|
|
Jewel Osco, 03721-Archer & Austin
🚩
6107 S Archer Ave
| Supermarket/Grocery Store | 28.2 kg/sqft #43 Highest
| 1,413 tons
Lowest 25%
|
|
Jewel Osco, 03170-Pulaski & 55th St
🚩
5320 S Pulaski Rd
| Supermarket/Grocery Store | 27.7 kg/sqft #44 Highest
| 1,995 tons
Lowest 48%
|
|
03241-Paulina & Division
🚩
1341 N Paulina St
| Supermarket/Grocery Store | 27.3 kg/sqft #46 Highest
| 1,430 tons
Lowest 26%
|
Data Source:
Chicago Energy Benchmarking Data